Instagram Insights give real estate agents an instant view of the success of their marketing efforts. Learn how to read Instagram metrics and accurately measure your real estate Instagram campaign.
Technology
Getting Started with Instagram Analytics for Real Estate
All good social media marketing strategies start with accurate and relevant data. Instagram Insights give real estate professionals a detailed peek into how their Instagram content is engaged with, where viewers drop off, and all the demographic details in between.
Using Instagram analytic information, realtors can measure the impact of their marketing efforts and see if there is something they need to do differently or amp up.
Ready to get started?
Get Access to Instagram Insights
The first step is setting up a business account with Instagram. If you’re a working real estate agent running Instagram marketing, you should already have a business account. All you have to do is click on the setting icon in your Instagram profile, select “accounts”, scroll to the bottom of the page and and select switch to business account.
If you’ve recently switched to a business profile, you’ll notice that Instagram only collects data from posts that were published after the switched. Note that Insights are not accessible through desktop, so you’ll need a well-preforming smartphone or device.
What’s the Difference between Analytics and Metrics?
Throughout this article, we’ll be referring to two key terms in the digital marketing field: metrics and analytics.
Metrics are individual data points, like the exact number of how many people liked your new post or your follower count.
Analytics, on the other hand, are more general trends that are tracked and shown over time. Your Instagram Insights will provide you with specific metrics as well as broad-stroke analytic info.
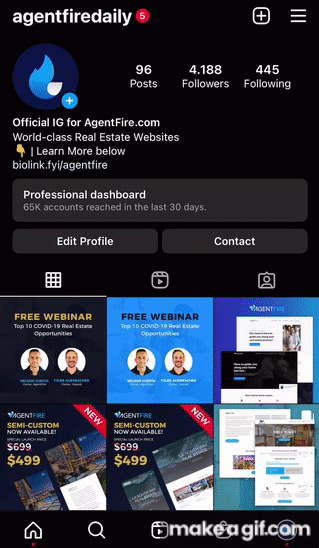
How to Access Instagram Insights Overview on Your Smart Device
The easiest way to get an overview of your analytic information is by clicking on the drop-down menu to the top right of your profile and clicking “Insights”. Within the Insights Overview, there are three main categories of analytics data: Accounts Reached, Accounts Engaged, and Total Followers. By clicking each option, you’ll have access to more detailed information in each respective category. Here’s what you’ll find:
Accounts Reached
- Top cities and countries
- Age range of followers
- Gender ratio
- Followers and non Follower reach
Accounts Engaged
- Top locations
- Engagements by followed and non-followed accounts
- Post interactions
- Most popular content
Total Followers
- Follower growth
- Top locations
- Age range
- Gender
- Most active times
This is a ton of information – and it’s only the beginning. Around this time is when many agents realize they have no idea what they’re looking at and click off the page. But wait! Depending on your social media marketing goals, some metrics are more valuable than others. You only truly need to pay attention to the metrics that are relevant to your campaign.
What are the Most Important Metrics for Agents to Track?
It’s easy to get caught up in the numbers and blue checkmarks. That’s why most agents set off-target goals that don’t provide the information needed to seriously improve business. Don’t start off by robotically measuring the number of likes, comments, followers etc.
Let’s imagine you’re trying to get more clicks on the lead magnet in your Instagram bio, in order to build up your CRM. Would you be counting the likes and comments on your Instagram stories? Not likely. In this case, web clicks and conversions are much more relevant metrics that accurately measure the success of your efforts.
On the other hand, if you’re growing your influencer network and want to gain local recognition, web clicks are a secondary or even irrelevant metric. In this case, we’d want to look at follower growth and post engagement to see if your popularity is increasing.
Every Relevant Key Metric for Real Estate Agents
There are a few main metrics you’ll run into across your Instagram Insights page. We’ve summed up what each metric means so that you can make a better decision about what to measure in your content strategy.
Follower Growth
Follower growth rate is a great way to measure the effectiveness of your Instagram account.
For example, if you notice a spike of followers after an informative carousel or a new hashtag, this is a valuable bit of information that you can use to inform your future content strategy.
Instagram doesn’t track how many followers you gain or lose, but gives a general outline of your growth over time and what causes spikes or dips.
Audience Demographics
A complete understanding of your audience demographics will allow you to sharpen your content and target the right prospects. Instagram gives business accounts detailed demographic information including gender, location, and more. Based on this demo data, construct an ideal target persona and shape your content planning around that.
Web Clicks
If the link in your bio is getting a ton of clicks, it’s a great sign. You likely have a lot of profile visitors and an engaging CTA somewhere in your profile. You can tuck a CTA into your Instagram profile, post, captions, or story.
To see how much traffic you’re bringing in from your bio link, we recommend using a UTM code and Google Analytics.
Reach and Impression
Reach tells us how many people have seen our posts. Any account that views any of your content is considered one account “reached”. If your post reach is declining, take a look of when you’re publishing content. There isn’t a single perfect time to post on Instagram. Each business has its own perfect time to post.
Impressions are specific actions. For example, if someone scrolls through your carousel three times, that counts as three impressions.
If you want to know how many individuals you actually connected with, reach is a more relevant metric.
Drop Off Rates
Drop-off rates refer to how many people stop watching your stories and when. If your drop-off rate was high after a particular story post, you know that you lost your audience’s attention because of that particular post or the posts leading up to it.
Content Interactions
Interactions are anything that your viewers do with your post. Likes, comments, saves, and shares are the most common ways to engage with a post.

Relevant Metrics for Different Instagram Posts
Feed posts
Within each individual post on your feed (e.g. photos, videos, carousels), is the option to dive into analytic details around that particular post. Click view insights under a post in your feed to see details such as:
- Likes
- Comments
- Shares
- Saves
- Interactions
- Discovery reach
- Impressions
Stories Metrics
To access your story metrics, tap the insight button at the top right of your story. Under the content you share, you’ll find your stories. Relevant story metrics include:
- Story engagement
- Story completion rate
- Back taps
- Call button taps
- Email Button Taps
- Drop-offs
- Follows
- Next Story
- Impressions
- Link Clicks
- Post Skips
- Reach
- Text Buttons Taps
By assessing which stories kept your viewers hooked and engaged, you’ll get a good idea of what content you should continue to create.
Reel Metrics
The last major type of post is Instagram Reels. To see your Reel metrics, click into the Reel and below the Reel, click insights. In Reel Insights, you’ll find:
- Reel shares
- Reel interactions
- Drop-off rate
- Average Percentage Watched
- Web Taps
- Email Button Taps
- Follows
- Business address taps
- Profile visits
- Reach
Instagram Insights Shortfalls
Like every tech tool, Instagram Insights has its downfalls. The main downside of this native tool is that the date ranges for analytics information are quite limited. Most date ranges are week by week or a few months at most. Regardless, Instagram Insights is a great starting place if you’re just learning how to read and measure your Instagram marketing metrics.
There are loads of additional Instagram Marketing tools available online. Whether or not you need additional Instagram marketing tools depends on how big Instagram is in your content strategy.
However, these tools aren’t free and often come with a hefty monthly fee depending on the number of connected accounts and team members. For beginners, Instagram Insights is just fine.
Conclusion…
Instagram is not only an extremely dynamic and effective social network, it is a resource to learn more about your community outreach and content. Instagram insights are an easy, beginner-friendly way to start learning about digital analytics and monitoring the right metrics.
After clarifying your social media marketing goals, put your analytics knowledge to the test and track your campaign success.
If you want more in-depth articles, tactics, strategies, and advice – subscribe to our newsletter, The Spark. And if you want to dominate your hyperlocal real estate market, check out AgentFire’s Web Designs, #1 rated for several years in a row.


